File:AAP cta survey plot ctr 3.pdf

Size of this JPG preview of this PDF file: 800 × 544 pixels. Other resolutions: 320 × 218 pixels | 640 × 435 pixels | 841 × 572 pixels.
Original file (841 × 572 pixels, file size: 35 KB, MIME type: application/pdf)
Summary
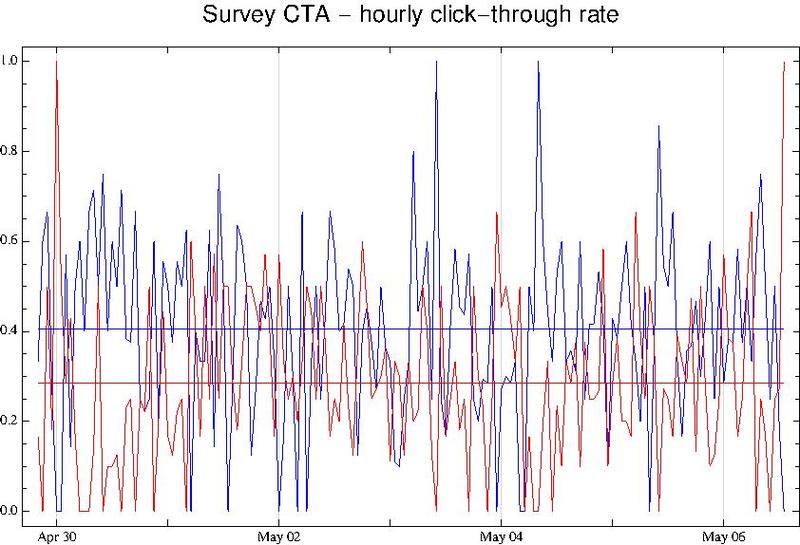
editHourly click-through rate for the survey call-to-action, part of the Article Feedback study. Data was collected using AFT v.3 between 2011-04-29 19:00:00 and 2011-05-06 13:00:00. Color codes event type: "accept" (blue) and "reject" (red), horizontal lines represent means calculated over the data collection period.
Licensing
edit| This file has been released into the public domain by the copyright holder, its copyright has expired, or it is ineligible for copyright. This applies worldwide.
Please verify that the reason given above is valid! |
File history
Click on a date/time to view the file as it appeared at that time.
| Date/Time | Thumbnail | Dimensions | User | Comment | |
|---|---|---|---|---|---|
| current | 05:30, 8 May 2011 |  | 841 × 572 (35 KB) | DarTar (talk | contribs) | Hourly click-through rate for the survey call-to-action, part of the Article Feedback study. Data was collected using AFT v.3 between 2011-04-29 19:00:00 and 2011-05-06 13:00:00. Color codes event type: "accept |
You cannot overwrite this file.
File usage
The following page uses this file: