Analytics/Reports/ULSFOImpact
Introduction
editThe operations team deployed ULSFO on February 2014 and we have done some data analysis to help them quantify the impact of the rollout on latency.
The exact dates of the rollout by country/region codes can be found in operations/dns' git history: https://git.wikimedia.org/summary/?r=operations/dns.git
Methodology
editFirst stab at data analysis includes only calculating percentile 50 and 90 for 3 regions: Ocenia, Asia (and SE Asia) and North America for a 3 week period. The week of the 26th of January (week1), which precedes the ULSFO deployment, the following one (week2, when the deployment was taking place) and the one after (week3).
Data comes from Event Logging Navigation Timing Schema (https://meta.wikimedia.org/wiki/Schema:NavigationTiming). We have removed mobile data and only used data for which user was anonymous, i.e. not logged in. We have also removed redirects from dataset and for plots we are only considering requests on a cold cache (i.e. not cached). Our original dataset had about 6 million datapoints, with the restrictions of removing mobile data, warm data..etc, we were left with about 1.7 million datapoints for two weeks of data for the whole world. The daily dataset we have to calculate weekly percentiles greatly differs by region. For Oceania we have about 2000 points per day (for all countries) to calculate daily percentiles. For North America the size of the daily dataset is on order of magnitude greater, about 20.000 samples per day. For SE Asia the daily sample for all countries is about 11.000.
We have less data for the 15th of February as there was a change of Navigation Schema on that date, to rule out any changes to the EL sampling or implementation we are just using data that we know comes from the same schema.
Select from navigation timing table is below. We have filtered these records to plot only times for requests which a dnslookup is happening, we have also removed outliers.
select timestamp, event_requestStart,event_responseEnd,
event_mediaWikiLoadComplete,event_domInteractive, event_originCountry,
event_dnsLookup,event_connectStart,event_responseStart,
event_connectEnd from NavigationTiming_6703470 where timestamp < 20140216000000
and timestamp > 20140126000000  and event_mobileMode is NULL
and event_redirectCount is NULL and event_isAnon=True order by timestamp asc
Measures
editAll Browsers
editmediaWikiLoadComplete This checkpoint is of our own measure and thus present for all browsers, we are plotting it below only for browsers that report network times and thus we are only plotting it for browsers that implement the navigationTiming API. It measures the time from mediawiki's startup.js to the tick following the load event. This has an impact on UX as the lower this variable is, the fastest the page is rendering.
Navigation Timing API measures
editThis data point is provided by request timing API and thus not available on IE8 and below. See: http://caniuse.com/#feat=nav-timing Note that big improvements in network time do not necessarily translate in faster load pagetimes overall.

We have plotted here responseStart - connectStart time which represents the time spent in the network until first byte arrives minus the time spent in DNS lookups (for a more visual explanation take a look at the Navigation timing graph) If there was a tcp connection drop the time will include the setup of the new connection.
Results
editLatency: Plots
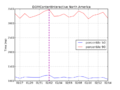
editThere are substantial drops in latencies in the OC and Asia region. Differences are not so substantial for North America. There seems to be anomalous data for the 14th of February for the SE Asia region.
The time to 1st byte measure displays bigger gains, it is important to understand that improvements on network time do not translate directly in gains on overall page latency. For example, if we need 4 network trips to compose a page and if the round trips 2,3,4 are happening while I am parsing the main document (round trip 1) which is huge (let's say) I will only see improvements from the 1st request. Subsequent ones are done in parallel and totally hidden under the fetching of the first one.
-
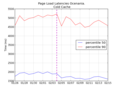 Total Latencies Oceania (ms)
 -
 Total Latencies SE Asia (ms)
 -
 Total Latencies North America (ms)


-
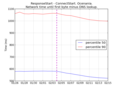 Network time minus DNS lookup Oceania (ms)
 -
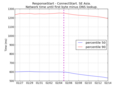 Network time minus DNS lookup SE Asia (ms)
 -
 Network time minus DNS lookup North America (ms)


-
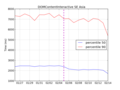
 DomInteractive Oceania (ms)
 -
 DOMInteractive SE Asia (ms)
 -
 DOMInteractive North America (ms)


Precise Differences on Overall Page Latency after Deployment per Country
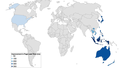
editThe gains of Japan and Indonesia are remarkable, page load times dropped up to 300ms. We see smaller (but measurable) improvements of 40 ms in the US too
We have calculated overall page latency for SE Asia, Oceania and North America countries for three different weeks. The week of the 26th of January (week1), which precedes the ULSFO deployment, the following one (week2, when the deployment was taking place) and the one after (week3). The overall page latency measure is the 50th weekly percentile of mediawikiLoadComplete calculated per country per week for countries for which we had at least 1000 data points per week. A bigger positive difference among weeks means the page got that much faster. Since we are measuring using data from mediawikiLoadComplete the faster times do have an impact on the UX experience, that is, users are seeing faster pages.
In order to quantify gains in page rendering time we have taken the difference between the 50th percentile of week1 and week2 and the difference between 50th percentile of week1 and week3. The ULSFO deployment is happening on week2 so it is likely that there are greater gains on later weeks (week3), the problem with calculating latency differences with later weeks is that there are too many variables that might be skewing our data. Data is spotty on the 15th of February and also on the 14th is atypical. It is hard to quantify absolute gains but looks like in Japan, Korea and Indonesia gains are of several hundreds of milliseconds. Variability of weekly percentiles seems to be around 100 ms or less.
Maps
edit-
 Improvement in Page Load Time (map with carto db)
.png)
-
 Improvement in Page Load Time (map with vega)

Data
edit| Country | 50th pctl week1 01/26 (ms) | 50th pctl week2 02/02 (ms) | 50th pctl week3 09/02 (ms) | Difference week1-week2 | Difference week1-week3 |
|---|---|---|---|---|---|
| Japan | 1596.0 | 1484.0 | 1268.0 | 112.0 | 328.0 |
| Hong Kong | 1814 | 1802 | 1721 | 12 | 93 |
| Philippines | 3182 | 3066.5 | 2881 | 115.5 | 301 |
| Vietnam | 2472 | 2396 | 2253.5 | 76 | 218.5 |
| Australia | 2064.0 | 1919 | 1735.0 | 145.0 | 329.0 |
| Malasia | 2459.0 | 2428 | 2152 | 31.0 | 307.0 |
| New Zealand | 1807.0 | 1688 | 1546.0 | 119.0 | 261.0 |
| Canada | 1003.0 | 1009.0 | 993.0 | -6.0 | 10.0 (not significant) |
| Korea | 1525.0 | 1374 | 1172.0 | 151.0 | 353.0 |
| Singapore | 2001 | 1940 | 1712 | 61 | 289 |
| US | 1071.0 | 1072 | 1030 | -1.0 | 41.0 |
| Taiwan | 1678 | 1536 | 1442.5 | 142 | 235.5 |
| Thailand | 2461 | 2457.5 | 2340.5 | 3.5 | 120.5 |
| Indonesia | 3675 | 3594.5 | 3290 | 80.5 | 385 |
Caveats
editImprovements in Canada are really too small for a such a diverse dataset, we probably should not mention them. If we use data for all countries with at least 1000 samples total there are countries like Palestine or Luxembourgh reporting also 300ms dropouts so how can we quantify these drops are only relative to ULSFO? If we use data for countries that have at least 1000 samples per week data looks much more consistent and we do not see changes on the range of 300 ms anymore, other than for China (CN)
If we remove ULSFO countries we should have (in a controlled experiment) no changes in weekly percentiles for overall latency in our country dataset. This is not the case (expected, was no controlled experiment). However, variability of results among weeks is quite big. Seems like normal variability among weeks is capped at around 100ms.
Data for all non ULSFO countries is below, we are listing countries for which we have at least 1000 data points per week for a 3 week period.
ISO codes per country: http://userpage.chemie.fu-berlin.de/diverse/doc/ISO_3166.html
| Country | 50th pctl week1 01/26 (ms) | 50th pctl week2 02/02 (ms) | 50th pctl week3 09/02 (ms) | Difference week1-week2 | Difference week1-week3 |
|---|---|---|---|---|---|
| 1220 | 1208.0 | 1204.0 | 12.0 | 16.0 | |
| BE | 913 | 930.0 | 901 | -17.0 | 12 |
| BG | 1110.0 | 1109.5 | 1107 | 0.5 | 3.0 |
| BA | 1284 | 1360.0 | 1402 | -76.0 | -118 |
| BR | 1952 | 2001 | 2050.0 | -49 | -98.0 |
| BY | 1971.0 | 1970 | 2070 | 1.0 | -99.0 |
| RU | 1585.0 | 1619.0 | 1678 | -34.0 | -93.0 |
| RS | 1242.0 | 1230.0 | 1241 | 12.0 | 1.0 |
| LT | 1037.0 | 1036 | 1000 | 1.0 | 37.0 |
| RO | 1163.0 | 1185.0 | 1147 | -22.0 | 16.0 |
| GT | 2102 | 2226.0 | 2273 | -124.0 | -171 |
| GR | 1294.0 | 1316 | 1308.5 | -22.0 | -14.5 |
| GE | 1456.0 | 1409 | 1432.0 | 47.0 | 24.0 |
| GB | 1062 | 1061.0 | 1036.0 | 1.0 | 26.0 |
| SV | 2061 | 2204 | 2066.0 | -143 | -5.0 |
| TN | 2163.0 | 2111 | 2135.5 | 52.0 | 27.5 |
| HR | 1101.5 | 1131.0 | 1101 | -29.5 | 0.5 |
| HU | 1224.5 | 1242 | 1316 | -17.5 | -91.5 |
| CR | 1790 | 1811.5 | 1797.5 | -21.5 | -7.5 |
| VE | 2395.0 | 2380 | 2507.0 | 15.0 | -112.0 |
| PR | 1504.0 | 1518.0 | 1558 | -14.0 | -54.0 |
| PT | 1192 | 1187 | 1235.5 | 5 | -43.5 |
| PE | 1781.5 | 1752 | 1858.5 | 29.5 | -77.0 |
| PK | 2946 | 3109 | 2988.0 | -163 | -42.0 |
| PL | 1280 | 1396.0 | 1346 | -116.0 | -66 |
| EE | 1047 | 1060 | 1086 | -13 | -39 |
| EG | 3243.5 | 3140 | 3238 | 103.5 | 5.5 |
| ZA | 2256.0 | 2313 | 2075 | -57.0 | 181.0 |
| EC | 2152 | 2105.0 | 2030.0 | 47.0 | 122.0 |
| IT | 1245.0 | 1235 | 1232 | 10.0 | 13.0 |
| KZ | 2282 | 2403 | 2496 | -121 | -214 |
| EU | 775.5 | 777 | 844.5 | -1.5 | -69.0 |
| SA | 2088 | 2044.5 | 2016.0 | 43.5 | 72.0 |
| ES | 1316 | 1315.0 | 1333 | 1.0 | -17 |
| MD | 1422 | 1533.0 | 1530 | -111.0 | -108 |
| UY | 2124 | 2236 | 2156 | -112 | -32 |
| MK | 1285.5 | 1328 | 1369 | -42.5 | -83.5 |
| MX | 1899 | 1951 | 1961 | -52 | -62 |
| FR | 1288.0 | 1289 | 1238 | -1.0 | 50.0 |
| FI | 911 | 1028.0 | 939.5 | -117.0 | -28.5 |
| NL | 849 | 850.0 | 818.5 | -1.0 | 30.5 |
| NO | 935.0 | 935 | 948 | 0.0 | -13.0 |
| CH | 841.0 | 873 | 828 | -32.0 | 13.0 |
| CO | 1881.5 | 1914 | 1949.0 | -32.5 | -67.5 |
| CN | 2842 | 2887.0 | 3485.0 | -45.0 | -643.0 |
| CL | 2075.0 | 2006.0 | 2049.0 | 69.0 | 26.0 |
| CZ | 1109.0 | 1104.0 | 1144 | 5.0 | -35.0 |
| MA | 2594 | 2432.0 | 2408 | 162.0 | 186 |
| SK | 1210 | 1183.0 | 1177 | 27.0 | 33 |
| SI | 997.5 | 1062.5 | 1035.0 | -65.0 | -37.5 |
| SE | 871 | 887 | 850 | -16 | 21 |
| DO | 2128 | 2146 | 2225.0 | -18 | -97.0 |
| DK | 948.0 | 937.5 | 897.0 | 10.5 | 51.0 |
| DE | 898 | 901 | 891 | -3 | 7 |
| AT | 886 | 905 | 874 | -19 | 12 |
| DZ | 3061 | 3097.5 | 2969 | -36.5 | 92 |
| LV | 1202.5 | 1280.0 | 1245 | -77.5 | -42.5 |
| NULL | 1343 | 1324.0 | 1329.0 | 19.0 | 14.0 |
| TR | 1478.0 | 1473 | 1511.0 | 5.0 | -33.0 |
| AE | 1497.5 | 1457 | 1450.0 | 40.5 | 47.5 |
| IR | 3279 | 3422.0 | 3341 | -143.0 | -62 |
| AM | 1692 | 1661 | 1692.5 | 31 | -0.5 |
| AL | 1447 | 1470.0 | 1420.0 | -23.0 | 27.0 |
| AR | 2286.0 | 2284 | 2332.0 | 2.0 | -46.0 |
| IL | 1292 | 1272.5 | 1320 | 19.5 | -28 |
| IN | 2384 | 2409 | 2421.0 | -25 | -37.0 |
| AZ | 1664 | 1649 | 1660.5 | 15 | 3.5 |
| IE | 1249.5 | 1275.0 | 1235.0 | -25.5 | 14.5 |
| UA | 1562 | 1566.0 | 1616 | -4.0 | -54 |
Reading
edithttp://www.igvita.com/2012/04/04/measuring-site-speed-with-navigation-timing/
connectStart the time immediately before the user agent starts establishing the connection to the server to retrieve the document.
connectEnd the time immediately after the user agent finishes establishing the connection to the server to retrieve the current document.
requestStart the time immediately before the user agent starts requesting the current document from the server.
responseStart the time immediately after the user agent receives the first byte of the response from the server.
Code
editWorkflow to process data:
- Produce cvs file from mysql select referenced above: https://gist.github.com/nuria/9052770#file-process-sql-data-change-timestamps-to-day-precision
- Process cvs file and convert second timestamps to day timestamps:
https://gist.github.com/nuria/9052770#file-calculate-weekly-percentiles-per-country
- Calculate daily percentiles per region:
https://gist.github.com/nuria/9052770#file-calculate-and-plot-daily-percentiles
- Calculate weekly percentiles per country
See: https://gist.github.com/nuria/9052770
Times of ulsfo rollout
editOcenia 36d4233c 2014-02-04 08:51:55 -0600 OC => ulsfo, OC maps to these countries: AS AU CK FJ FM GU KI MH MP NC NF NR NU NZ PF PG PN PW SB TK TO TV UM VU WF WS East/Southeast Asia 1fb1dd5d 2014-02-06 13:57:01 +0200 BD => ulsfo, # Bangladesh 43d8c957 2014-02-12 17:05:46 +0200 BT => ulsfo, # Bhutan 43d8c957 2014-02-12 17:05:46 +0200 HK => ulsfo, # Hong Kong 1fb1dd5d 2014-02-06 13:57:01 +0200 ID => ulsfo, # Indonesia 5e704168 2014-02-05 07:36:13 -0600 JP => ulsfo, # Japan 465877aa 2014-02-05 21:05:44 -0600 KH => ulsfo, # Cambodia 5e704168 2014-02-05 07:36:13 -0600 KP => ulsfo, # Korea, Democratic People's Republic of 5e704168 2014-02-05 07:36:13 -0600 KR => ulsfo, # Korea, Republic of 1657beef 2014-02-06 14:39:23 +0200 MM => ulsfo, # Myanmar 1fb1dd5d 2014-02-06 13:57:01 +0200 MN => ulsfo, # Mongolia 43d8c957 2014-02-12 17:05:46 +0200 MO => ulsfo, # Macao 465877aa 2014-02-05 21:05:44 -0600 MY => ulsfo, # Malaysia 465877aa 2014-02-05 21:05:44 -0600 PH => ulsfo, # Philippines 465877aa 2014-02-05 21:05:44 -0600 SG => ulsfo, # Singapore 1657beef 2014-02-06 14:39:23 +0200 TH => ulsfo, # Thailand 465877aa 2014-02-05 21:05:44 -0600 TW => ulsfo, # Taiwan, Province of China cfacc95a 2014-02-06 13:58:32 +0200 VN => ulsfo, # Viet Nam US ba8e43dc 2014-02-06 14:40:02 +0200 AK => ulsfo, # Alaska 7890e1fd 2014-02-06 15:53:26 +0200 AZ => ulsfo, # Arizona ba8e43dc 2014-02-06 14:40:02 +0200 CA => ulsfo, # California 7890e1fd 2014-02-06 15:53:26 +0200 CO => ulsfo, # Colorado ba8e43dc 2014-02-06 14:40:02 +0200 HI => ulsfo, # Hawaii 7890e1fd 2014-02-06 15:53:26 +0200 ID => ulsfo, # Idaho 7890e1fd 2014-02-06 15:53:26 +0200 MT => ulsfo, # Montana 7890e1fd 2014-02-06 15:53:26 +0200 NM => ulsfo, # New Mexico 7890e1fd 2014-02-06 15:53:26 +0200 NV => ulsfo, # Nevada ba8e43dc 2014-02-06 14:40:02 +0200 OR => ulsfo, # Oregon 7890e1fd 2014-02-06 15:53:26 +0200 UT => ulsfo, # Utah ba8e43dc 2014-02-06 14:40:02 +0200 WA => ulsfo, # Washington 7890e1fd 2014-02-06 15:53:26 +0200 WY => ulsfo, # Wyoming Canada 7890e1fd 2014-02-06 15:53:26 +0200 AB => ulsfo, # Alberta ba8e43dc 2014-02-06 14:40:02 +0200 BC => ulsfo, # British Columbia 7890e1fd 2014-02-06 15:53:26 +0200 NT => ulsfo, # Northwest Territories ba8e43dc 2014-02-06 14:40:02 +0200 YT => ulsfo, # Yukon Territory